Hardness
Not reported
No measured value availableHardness is not estimated from location.
At least one sampling point averaged above an EPA PFAS limit in EPA's national PFAS survey. This is a screening result, not a violation. The strongest city-index PFAS flag is PFOA, at 1.8× the screening comparison. EPA evaluates PFAS compliance using running annual averages, so FilterTier labels this a screening result rather than a violation.
Same four checks on every city page, always in the same order. Missing values are labeled, never guessed.
Health-based limit-exceedance records since Oct. 2021; resolved or archived records are not presented as current.
Period ending September 2025.
Detected examples: PFBS, PFPeA, PFHxA, PFOA….
Hardness is not estimated from location.
Each row identifies the result, its data period and its source. Missing measurements are not estimated.
| Result | Finding / comparison | Date / period | Source |
|---|---|---|---|
| Health-based violations | No health-based limit-exceedance flag in these water-system records. | Since Oct. 2021 | EPA drinking-water data |
| Lead · 90th percentile | 2 ppb · Below the 15 ppb action level | September 2025 | EPA Lead & Copper data |
| PFBS | Highest single sample 10 ng/L · No individual federal MCL shown for this compound Single-sample values are context only; EPA PFAS compliance is based on running annual averages. | UCMR 5 survey period | EPA UCMR 5 |
| PFPeA | Highest single sample 9.9 ng/L · No individual federal MCL shown for this compound Single-sample values are context only; EPA PFAS compliance is based on running annual averages. | UCMR 5 survey period | EPA UCMR 5 |
| PFHxA | Highest single sample 9.1 ng/L · No individual federal MCL shown for this compound Single-sample values are context only; EPA PFAS compliance is based on running annual averages. | UCMR 5 survey period | EPA UCMR 5 |
| PFOA | Highest single sample 8.1 ng/L · EPA MCL 4 ng/L Single-sample values are context only; EPA PFAS compliance is based on running annual averages. | UCMR 5 survey period | EPA UCMR 5 |
| PFBA | Highest single sample 7.6 ng/L · No individual federal MCL shown for this compound Single-sample values are context only; EPA PFAS compliance is based on running annual averages. | UCMR 5 survey period | EPA UCMR 5 |
| PFOS | Highest single sample 6 ng/L · EPA MCL 4 ng/L Single-sample values are context only; EPA PFAS compliance is based on running annual averages. | UCMR 5 survey period | EPA UCMR 5 |
| PFNA | Highest single sample 4.5 ng/L · EPA MCL 10 ng/L Single-sample values are context only; EPA PFAS compliance is based on running annual averages. | UCMR 5 survey period | EPA UCMR 5 |
| PFHpA | Highest single sample 3.3 ng/L · No individual federal MCL shown for this compound Single-sample values are context only; EPA PFAS compliance is based on running annual averages. | UCMR 5 survey period | EPA UCMR 5 |
| Hardness | Not reported. Hardness is not estimated from location. | Not reported | A utility report or water test is needed for a measured value. |
PFAS is the main screening flag in this report. At least one sampling point averaged above the comparison level used for PFOA in EPA's national survey. EPA evaluates compliance using annual averages, so FilterTier does not call this a violation. If PFAS is your priority, favor exact-system certification and then check whether the certified flow can support your home.
Flow demand, plumbing, maintenance and budget can change which treatment fits even when two homes share the same utility.
These are rule-based matches from the current FilterTier rankings. Size still depends on your home.
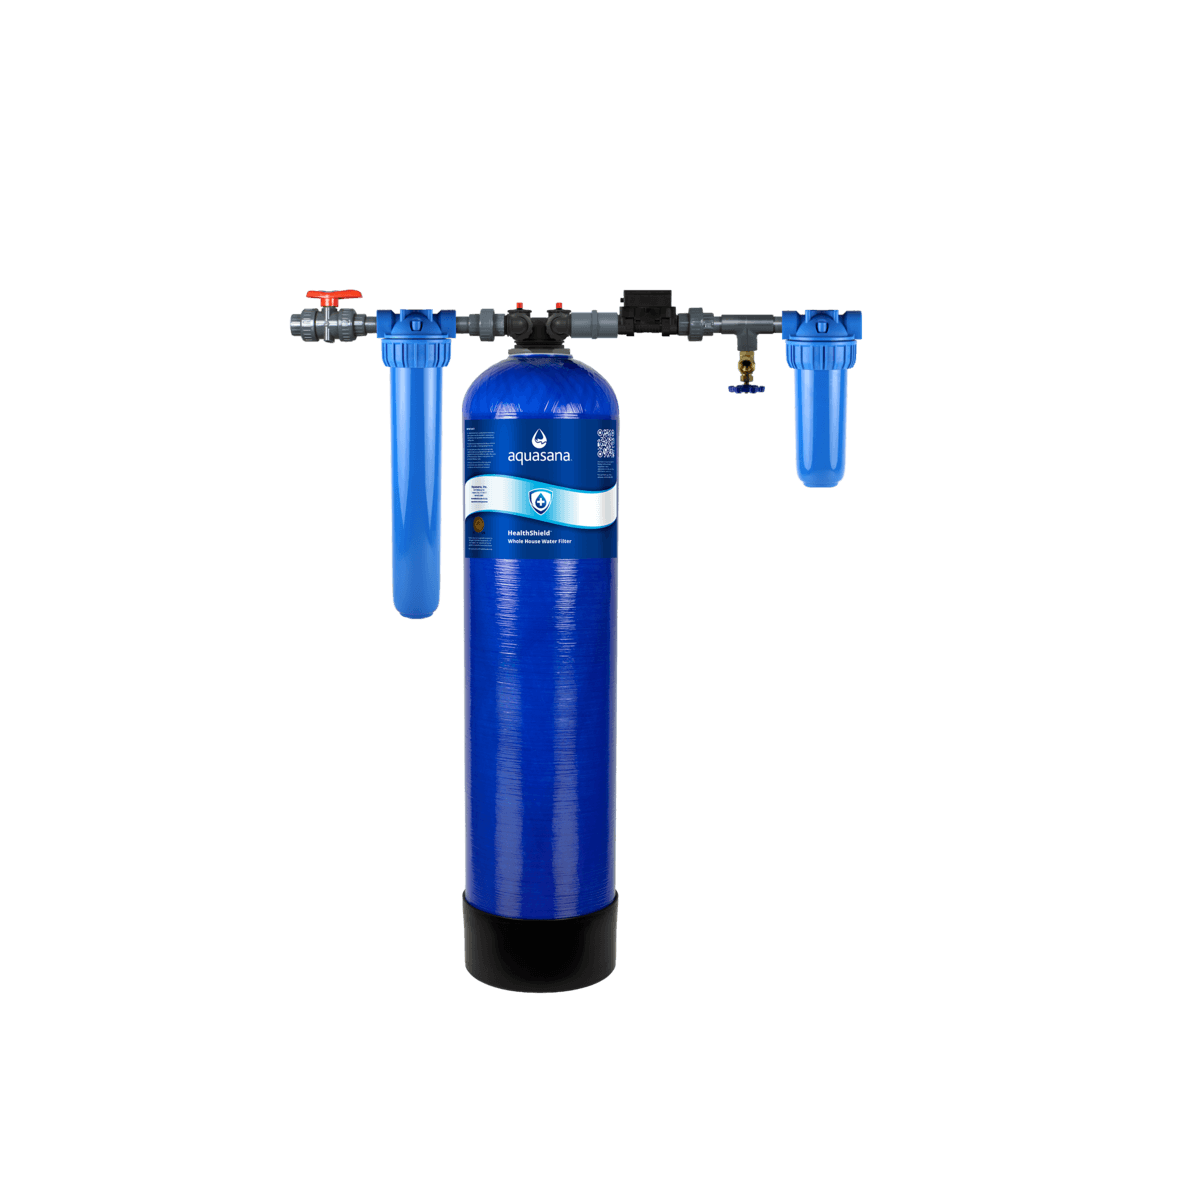
Matched because this city report has a PFAS screening flag and this is the current #1 PFAS-ranked exact system with documented reduction evidence.
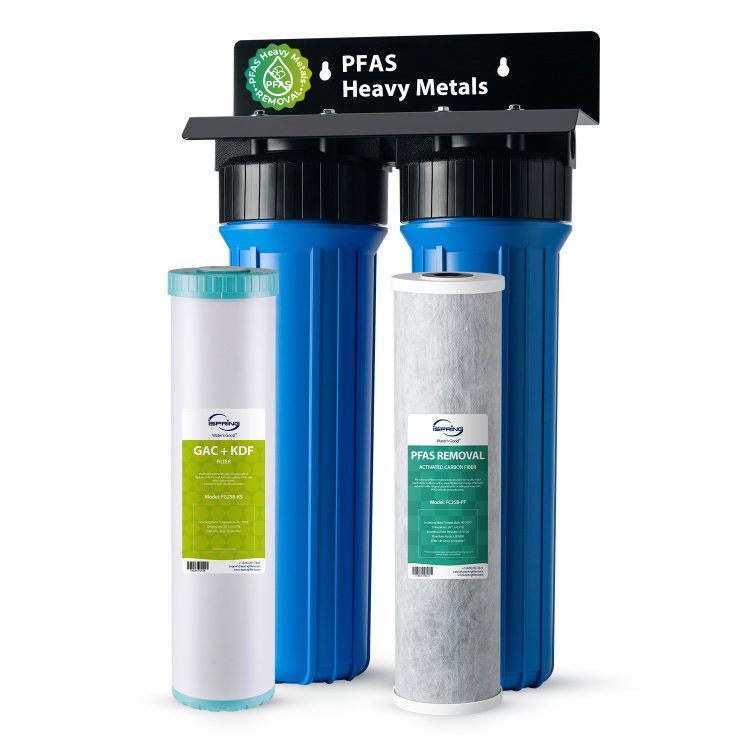
Current #2 PFAS-ranked system. Its exact-model PFAS product specifications and flow are verified; confirm the certification evidence that matters to your goal before buying.
Ranking updates can change these matches. Evidence label and flow are shown so the tradeoff stays visible.
This report covers Philadelphia Water Department system PA1510001. The same city can receive water from different treatment plants or mixtures. These utility observations are not an individual-home test or a verified ZIP-to-plant assignment.
Baxter treats water from the Delaware River; Belmont and Queen Lane draw from the Schuylkill River. The utility's 2025 average hardness was 101 mg/L (6 gpg) at Baxter, 151 mg/L (9 gpg) at Belmont and 169 mg/L (10 gpg) at Queen Lane. Individual neighborhoods may receive more than one plant's treated water. The original summary above says hardness is not reported in its EPA source dataset; this municipal plant-level evidence is distinct and is not a measured result for your tap.
The official report lists 2.0 ppb at the 90th percentile from 106 sampled customer taps in 2025, with one tap above the historical 15 ppb action level. This matches FilterTier's original federal-derived 2 ppb result for the period ending September 2025. A 90th percentile describes a sampled system, not an individual residence; service-line and fixture materials can change exposure.
Philadelphia's separate 2024 UCMR 5 survey reports highest single-location observations of 8.1 ppt PFOA and 6.0 ppt PFOS. Its 2025 municipal PFAS table instead records highest results of 6.1 ppt PFOA and 4.6 ppt PFOS, sampled quarterly at plants on January 22, April 14, July 14 and October 6, 2025. The utility reports no 2025 Pennsylvania PFAS MCL violation, with compliance based on plant-specific running annual averages. This is not proof of future federal compliance or zero PFAS at a home's tap.
Original municipal tables reviewed November 8, 2026. Federal raw measurements, 2026Q2 violation snapshot, PWS/ZIP joins, index/canonical and recommendations remain unchanged. The utility also reports a March 2026 Queen Lane turbidity sensor monitoring interruption; no water-quality emergency was reported by the utility, and the snapshot's violation count must not be interpreted as a comprehensive current notice feed.
A utility service area is not the same as a city boundary. Service-area maps can be approximate; confirm your provider on your bill.
Ask your provider about nearby communities and address-specific service coverage.
A shared system ID connects the reports, but does not mean every tap has identical water quality.
See the utility’s service-area map for coverage beyond this city.
Reported wholesale relationships may be seasonal, backup or partial supplies. They do not establish today’s water blend, treatment or an identical contaminant profile.
No supplier relationship was provided.
Housing estimates describe Philadelphia, not the materials, water quality or plumbing demand of your individual home.
Housing age does not confirm lead plumbing.
Tenure is context, not a treatment requirement.
Room count does not determine peak flow.
Explore the latest available outdoor air readings from AirNow. Credit: U.S. EPA AirNow and participating state, local and tribal air agencies. Live observations are preliminary and may change after quality assurance; they are not regulatory compliance determinations. Observation times are shown in the map. Missing readings do not mean clean air.
Open the live AirNow map ↗For validated regulatory air-quality data and trend analysis, use EPA AirData/AQS.
The water system covered in this report is Philadelphia Water Department (system ID PA1510001), serving about 1,600,000 people. If your bill shows another utility, use the ZIP report to confirm your system.
The latest 90th-percentile result in this dataset is 2 ppb for the period ending September 2025. Lead can also come from building plumbing, so utility results do not describe every tap.
At least one sampling point averaged above the screening comparison used by FilterTier for PFOA. EPA evaluates compliance using annual averages; this city-page result is a screening flag, not a violation.
Not automatically. The right treatment depends on the exact contaminants, your plumbing, household flow, maintenance preference and budget. Use the finder to combine this public-water profile with your home details.
Service boundaries can cross city limits, and a city may have more than one provider. Match the utility and system ID to your water bill before applying a public-water result to your address. Private wells need their own testing.
Utility identity, system ID, source-water context, violations and Lead & Copper results. For lead, the 15 ppb action level remains the applicable transition-period threshold until LCRI compliance begins November 1, 2027; FilterTier uses 10 ppb as a screening flag on these city pages.
National PFAS survey data used for the city screening rule. Survey data does not by itself establish MCL compliance. As of October 2026, PFOA/PFOS MCLs remain in force; EPA has separately proposed an optional compliance extension and proposed rescinding the PFHxS, PFNA, HFPO-DA and hazard-index provisions.
Match the provider and system ID to your water bill. Data snapshot: EPA SDWA 2026Q2 / UCMR 5 August 2026 final.
Official 2025 Philadelphia Water Department report explicitly identifies PA1510001.
Find the public water systems mapped to your ZIP and choose the one on your bill.