Hardness
Not reported
No measured value availableHardness is not estimated from location.
Metro Water Services met federal limits in the EPA records we checked. This report covers Metro Water Services, which serves about 778,153 people using surface water; missing results are labeled rather than inferred.
Same four checks on every city page, always in the same order. Missing values are labeled, never guessed.
Health-based limit-exceedance records since Oct. 2021; resolved or archived records are not presented as current.
Period ending December 2025.
EPA UCMR 5 testing is present in the water-system records; PFOA is the strongest summarized PFAS result and no screening flag was triggered. See the utility’s report for detailed sampling results.
Hardness is not estimated from location.
Each row identifies the result, its data period and its source. Missing measurements are not estimated.
| Result | Finding / comparison | Date / period | Source |
|---|---|---|---|
| Health-based violations | No health-based limit-exceedance flag in these water-system records. | Since Oct. 2021 | EPA drinking-water data |
| Lead · 90th percentile | 0.8 ppb · Below the 15 ppb action level | December 2025 | EPA Lead & Copper data |
| PFAS | Tested in UCMR 5; summarized city-index result includes PFOA, with no screening flag. See the utility’s report for detailed sampling results. | UCMR 5 survey period | EPA UCMR 5 |
| Hardness | Not reported. Hardness is not estimated from location. | Not reported | A utility report or water test is needed for a measured value. |
Metro Water Services did not trigger the lead or PFAS screening rules used for the headline. That does not mean every possible contaminant was tested or absent. For city water, treatment decisions can still depend on taste, disinfectant, plumbing, hardness and your own goals. The finder uses this report as a starting point, then asks about household flow and budget.
Flow demand, plumbing, maintenance and budget can change which treatment fits even when two homes share the same utility.
These are rule-based matches from the current FilterTier rankings. Size still depends on your home.
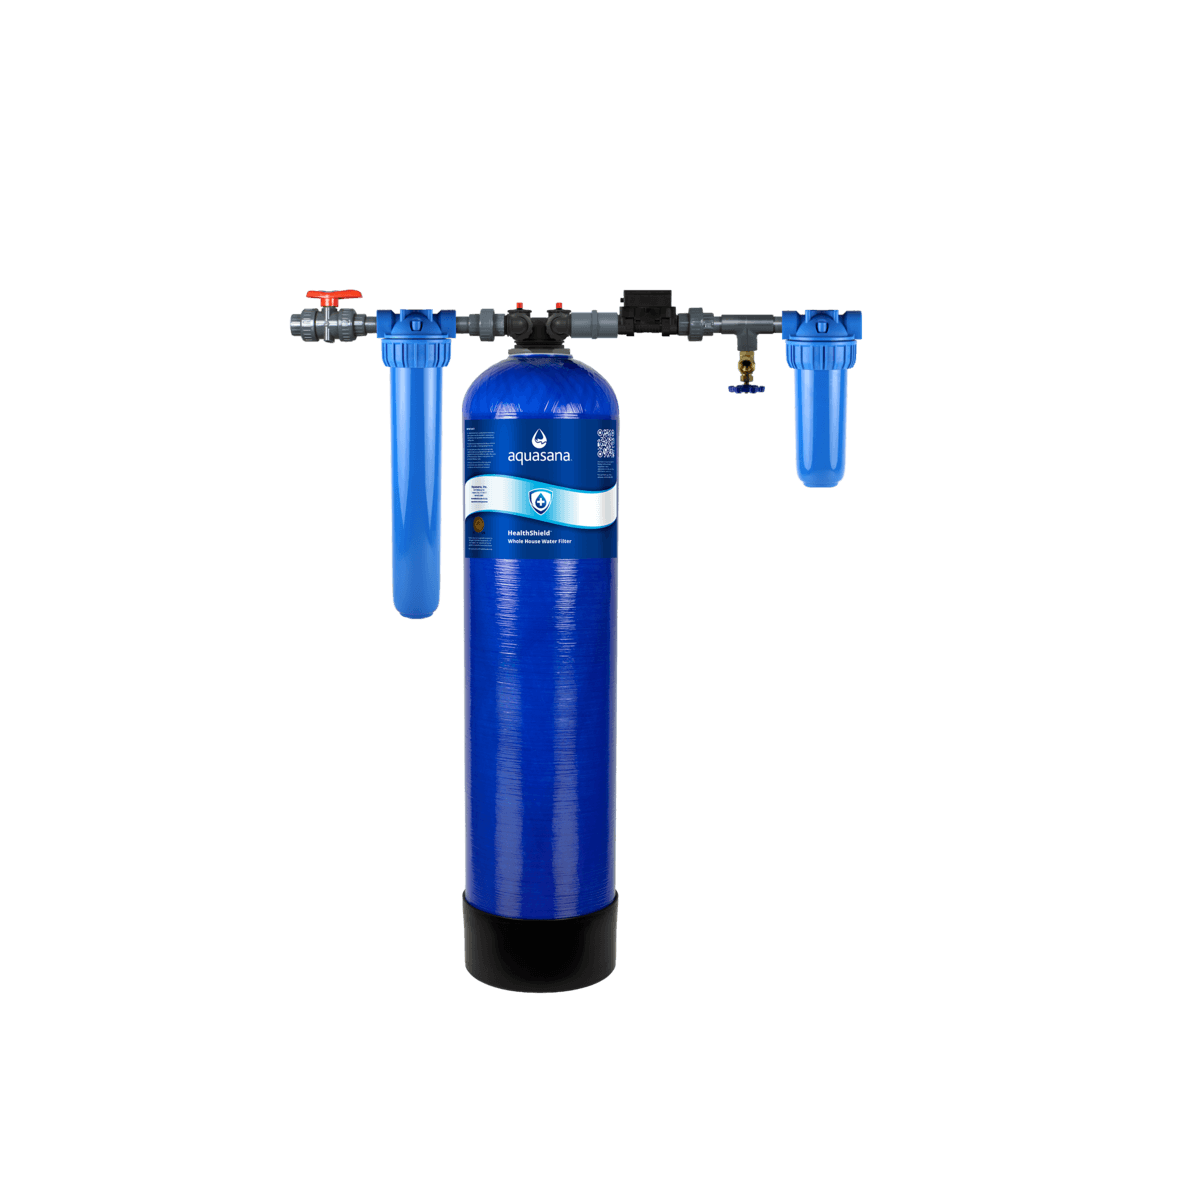
Current #1 on the city-water ranking. Exact-system health-effect reduction evidence is strong, but its 5.7 GPM certified/service flow makes household sizing important.
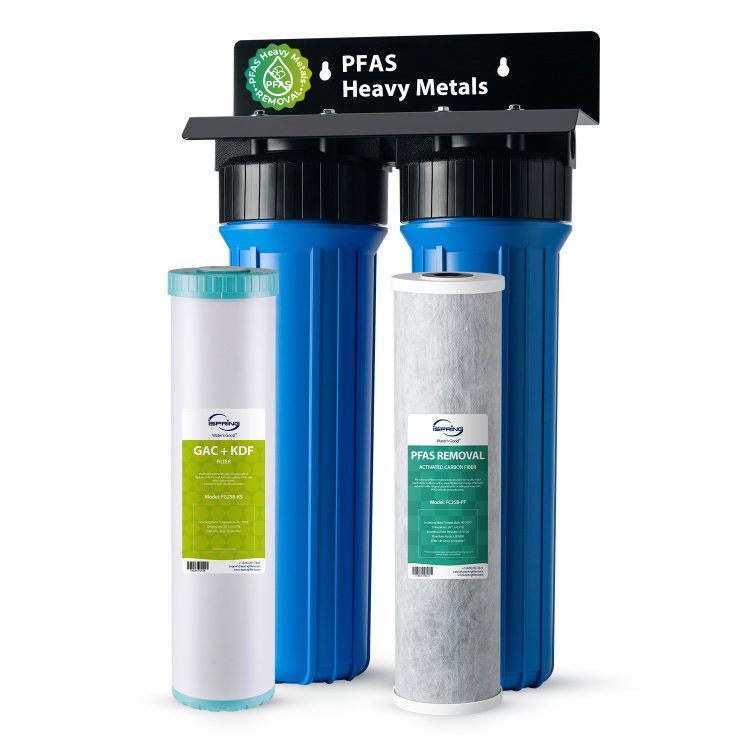
Current #2 on the city-water ranking. It offers much higher published flow, with verified exact-model PFAS/heavy-metal product data; confirm the exact certification evidence that matters to your goal.
Ranking updates can change these matches. Evidence label and flow are shown so the tradeoff stays visible.
Metro Water Services (PWSID TN0000494) operates the Omohundro and K.R. Harrington water-treatment plants and reports serving Davidson County and parts of Rutherford and Williamson counties. This is a utility service-area description, not a guarantee that every Nashville or suburban street uses the same provider. Verify the address on your water bill.
Metro Water Services' official lead-monitoring history, last updated July 8, 2026, lists 0.80 parts per billion in 2025 as the lead 90th percentile at selected distribution-system taps. The city compares that round with its listed 10.0 ppb action-level figure; older monitoring rounds on the same page show a 15.0 ppb comparison. This is not the same as 0.80 ppb at any specific kitchen faucet. The federal 2025-12-31 period-end date shown by FilterTier is a reporting cutoff and should not be misrepresented as a sample-collection day.
Metro Water Services' separate PFAS page provides the Omohundro and K.R. Harrington finished-water monitoring context, the specific compounds and published reporting/comparison values. A finished-treatment-plant table cannot predict household tap concentrations, and an EPA UCMR 5 unregulated-occurrence sample is not itself an enforceable-limit violation. The municipality's PFAS table, the 2025 annual report and the federal survey differ in period and regulatory purpose; one must not replace another or turn below-reporting-threshold measurements into absolute zero.
Metro Water Services' lead service-line inventory includes estimated material for both main-to-meter (public) and meter-to-home (private) portions, based on records and customer surveys. Unknown, suspected and verified materials are distinct, and the inventory cannot replace a physical investigation or tap sampling. It is especially important not to conclude that a property has no lead plumbing just because a citywide percentile was below the comparison value.
Original municipal HTML sources verified November 8, 2026. Lead 2025 regulatory round, municipal PFAS context and federal survey data are described separately; no underlying contaminant row, ZIP/PWS association, enforcement status, search-index controls, canonical or sitemap entry was modified.
A utility service area is not the same as a city boundary. Service-area maps can be approximate; confirm your provider on your bill.
A shared system ID connects the reports, but does not mean every tap has identical water quality.
Reported wholesale relationships may be seasonal, backup or partial supplies. They do not establish today’s water blend, treatment or an identical contaminant profile.
No supplier relationship was provided.
Housing estimates describe Nashville, not the materials, water quality or plumbing demand of your individual home.
Housing age does not confirm lead plumbing.
Tenure is context, not a treatment requirement.
Room count does not determine peak flow.
Explore the latest available outdoor air readings from AirNow. Credit: U.S. EPA AirNow and participating state, local and tribal air agencies. Live observations are preliminary and may change after quality assurance; they are not regulatory compliance determinations. Observation times are shown in the map. Missing readings do not mean clean air.
Open the live AirNow map ↗For validated regulatory air-quality data and trend analysis, use EPA AirData/AQS.
The water system covered in this report is Metro Water Services (system ID TN0000494), serving about 778,153 people. If your bill shows another utility, use the ZIP report to confirm your system.
The latest 90th-percentile result in this dataset is 0.8 ppb for the period ending December 2025. Lead can also come from building plumbing, so utility results do not describe every tap.
PFAS was included in the national survey data used here and no sampling-point average in the city index triggered the screening flag.
Not automatically. The right treatment depends on the exact contaminants, your plumbing, household flow, maintenance preference and budget. Use the finder to combine this public-water profile with your home details.
Service boundaries can cross city limits, and a city may have more than one provider. Match the utility and system ID to your water bill before applying a public-water result to your address. Private wells need their own testing.
Utility identity, system ID, source-water context, violations and Lead & Copper results. For lead, the 15 ppb action level remains the applicable transition-period threshold until LCRI compliance begins November 1, 2027; FilterTier uses 10 ppb as a screening flag on these city pages.
National PFAS survey data used for the city screening rule. Survey data does not by itself establish MCL compliance. As of October 2026, PFOA/PFOS MCLs remain in force; EPA has separately proposed an optional compliance extension and proposed rescinding the PFHxS, PFNA, HFPO-DA and hazard-index provisions.
Match the provider and system ID to your water bill. Data snapshot: EPA SDWA 2026Q2 / UCMR 5 August 2026 final.
Metro Water Services publishes the 2025 Consumer Confidence and complete Water Quality Reports.
Find the public water systems mapped to your ZIP and choose the one on your bill.